
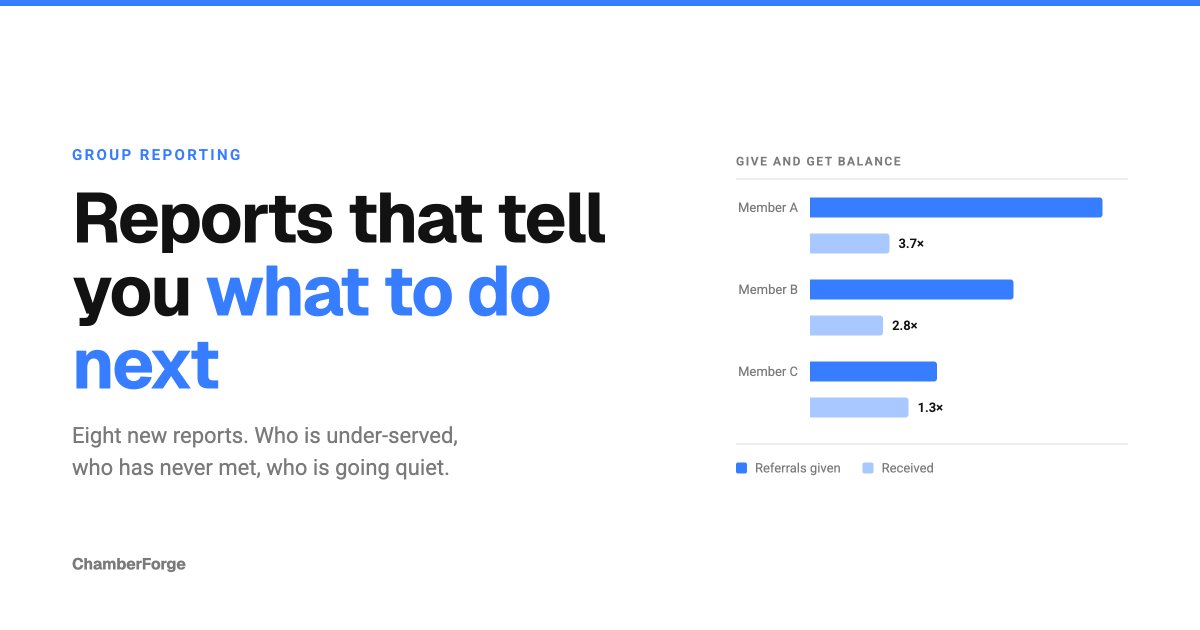
We have added eight reports to group reporting. Members now see eleven, managers see fourteen.
This was not about showing you more numbers. Every report we shipped before this one counted what had already happened: referrals given, revenue closed, meetings attended. All true, all useful, and none of them told you what to do when you closed the tab.
The eight new reports fill in that next column. Who is giving more than they get. Which pairs of members have never met. Who is going quiet.
Reports the whole group can see
Give and Get Balance
Referrals sent and referrals received, on the same row.
The gap between those two numbers is what a group actually runs on. A member giving four referrals for every one they get is the person most likely to quietly stop showing up, and a report that only counts what they sent will never surface it.
We show the ratio as well as the difference. One heavy giver can send more than the rest of the group combined, and on raw counts alone everyone else turns into a rounding error. The ratio is what makes the smaller members comparable to each other.
Breadth sits next to volume, too. Ten referrals to one member and ten spread across ten members are the same count and completely different behavior.
Referral Velocity
What happens to the referrals you hand over.
The existing Conversion Report measures the referrals a sender closed. This one is anchored on the receiver, because the receiver is the person who works a referral. Where referrals go to die is only visible from that angle.
You get received, won, lost, still open, and the median time to close. We added one more column: stale, meaning open with no change at all for over 90 days. Somebody handed that referral over and is still waiting for an answer.
For context, across ChamberForge the average won referral takes 39 days to close, measured over more than 57,000 of them. Put your group's number next to that one.
Each median carries its sample size. A median calculated from two referrals should not be read as a group norm, so we show you when it is.
One-to-One Coverage
Which pairs of members have never met.
A one-to-one count tells you how much meeting happened. It does not tell you whether the same four people met each other twelve times, and that is the question a manager needs answered before assigning the next round.
You get per-member coverage plus a flat list of the pairs that have not met yet. We deliberately did not build an N-by-N grid. A 48-member group is 1,128 cells, and there is nothing a manager can do with a cell. The list is the thing you can read out in a meeting.
Revenue Report - Member Pairs
Which relationships inside your group actually produce money.
Your group's revenue total tells you the group works. A list of member pairs tells you which relationships are doing that work, and which introductions are worth making next.
We trace revenue back through the referral behind it, so each row names the member who made the introduction and the member who closed the business.
Category Gap
Which seat to fill next, ranked by what it would be worth.
This report deliberately draws its two halves from different places. The seats your group has come from your own members. What an empty seat would be worth comes from the whole ChamberForge network.
One group does not have anywhere near enough history to say what a category it does not have would produce. The network does. So we calculate how much business your group's existing categories send into each missing category everywhere else, and rank the empty seats by that. Recruiting stops being a guess and becomes a ranked list.
Every gap also names the category in your own group that refers into it most, so you know which member to ask for the introduction.
These are network figures, not your group's, and the report says so on its own face.
Reports only managers can see
From here on, these are not the group's shared scoreboard. They report on individual members, so only managers can open them. More on that below.
At-Risk Members
Which members are fading right now, while there is still time to call them.
We compare the period you select against the equally long stretch immediately before it. The important part is that a member is measured against their own recent past, not against the group average. Someone who was never especially active and someone who was active and stopped are completely different situations, and only the second one needs a phone call.
Each member lands in one of four states:
- Silent, no activity at all in the selected period
- Declining, still active but at less than half their own prior rate
- Steady, holding or improving
- New, joined after the comparison period opened
That last state exists for a reason. Flagging someone who joined halfway through the comparison would blame them for a stretch of time they were not here for.
We also show the date of the last referral, last one-to-one and last attendance. Those columns look past the selected period at the member's whole history, because "nothing for five months" is a far more useful fact than "nothing in this window".
Retention and Churn
Who leaves, how fast, and which joining cohorts are bleeding.
Across ChamberForge, a member who leaves stayed an average of 433 days. But of the 2,692 departures on record, 27.5% were gone within six months and 55.1% within a year. More than half of everyone who leaves does not make it through their first year.
That is a number managers have had no way to see inside the product until now.
We group members into cohorts by the month they joined and show how much of each cohort is still here. Tenure and cohorts are calculated over all of history regardless of the range you pick, because a retention curve measured through a window is not a retention curve.
New Member Ramp
Whether new members are settling in, or quietly stalling.
For everyone who joined during the period you select, we count the days to their first referral, first one-to-one, first guest and first attendance, all measured from their own join date. Nothing that happened before they arrived counts toward it.
Members who have since left still appear. That is exactly the ramp failure this report exists to surface.
Read it alongside At-Risk Members. One is the early sign, the other is the outcome.
Reports now have access levels
As part of this work, every report now declares who can open it.
Most reports are the group's shared scoreboard and stay open to everyone. Reports that speak about individual members are restricted to managers. Who looks likely to quit is a manager's problem to act on, not something a group should be reading about each other.
The access level of the six reports you already had has not changed. Everything you could see before, you can still see.
In a manager's report list the options are now split into All members and Managers only, and a restricted report carries a marker above its results. That way a manager will not point members at a report they cannot reach, or share one on a screen without realizing what it is.
In short
Counting what happened and telling you what to do next are two different jobs. These eight reports are aimed at the second one.
You find them under the Reports tab in your group settings.